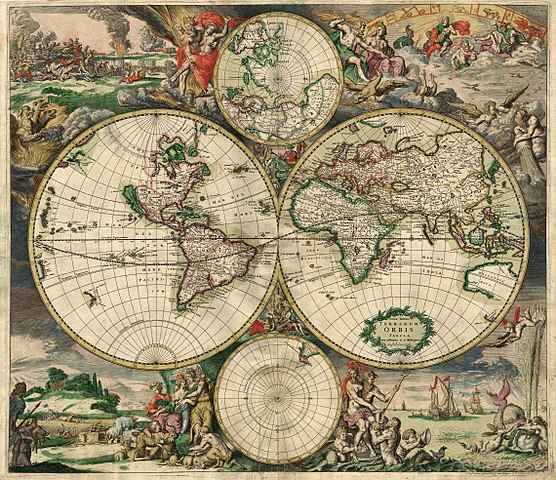
News maps, also known as informational graphics or data visualizations, play a significant role in modern journalism by providing visual representations of information, data, and stories. Their impact is multifaceted, influencing the way news is consumed, understood, and remembered. Here are some key aspects of the impact of news maps on modern journalism:
1. Enhanced Storytelling:
- Visual Context: Maps provide a visual context that enhances storytelling by helping audiences understand complex information and relationships.
- Geographical Insight: Geographic maps can illustrate the spatial aspects of a story, offering a sense of place and enabling readers to better connect with the narrative.

2. Data Visualization:
- Complex Information: News maps transform complex data into visual representations, making it easier for audiences to grasp and interpret information quickly.
- Trends and Patterns: Geographic data visualizations can reveal trends, patterns, and relationships that may be less apparent in raw data.
3. Audience Engagement:
- Interactive Maps: Online platforms allow for interactive maps that engage audiences by enabling them to explore data, zoom in on specific regions, and interact with information.
- Visual Appeal: Well-designed maps contribute to the overall visual appeal of news stories, attracting and retaining the attention of readers.
4. Geopolitical Analysis:
- International Reporting: News maps are crucial in international reporting, providing context to geopolitical events, conflicts, and global trends.
- Border Disputes: Geographic visualizations help explain border disputes, territorial changes, and other geopolitical developments.
5. Contextualization of Events:
- Temporal Context: Maps can show how events unfold over time, helping audiences understand the temporal context of stories.
- Historical Comparisons: Geographic visualizations can include historical maps, allowing for comparisons between past and present situations.
6. Crisis Reporting:
- Natural Disasters: Maps are instrumental in crisis reporting, illustrating the impact of natural disasters, tracking their progression, and aiding in relief efforts.
- Epidemics and Pandemics: During health crises, maps help visualize the spread of diseases, vaccination efforts, and healthcare infrastructure.
7. Data Transparency:
- Government Accountability: Maps can be used to visualize government data, promoting transparency and holding institutions accountable.
- Social Issues: They help shed light on social issues, such as income inequality, educational disparities, and environmental concerns.
8. Environmental Reporting:
- Climate Change: News maps are essential in reporting on climate change, illustrating its impact on different regions, sea-level rise, and temperature variations.
- Biodiversity: Maps visualize ecological data, helping to convey the state of biodiversity, habitat loss, and conservation efforts.
9. Economic Analysis:
- Trade and Commerce: Geographic visualizations aid in reporting on global trade, economic disparities, and commerce routes.
- Market Trends: They help convey economic data, market trends, and financial developments in a visually digestible format.
News maps, with their ability to distill complex information into accessible visuals, have become integral to modern journalism. They offer new dimensions to storytelling, contribute to data-driven reporting, and empower audiences to better understand the world around them. As technology advances, the role of news maps is likely to evolve, further shaping the landscape of journalism.


